I will get to the hard data in a moment. Briefly, based on analyzing data that consistently precedes (as in “leads”) future developments, I expect interest rates to RISE further across the next few years in the US (and beyond). Today is July 15, 2024.
Why do I expect interest rates to rise NOW?
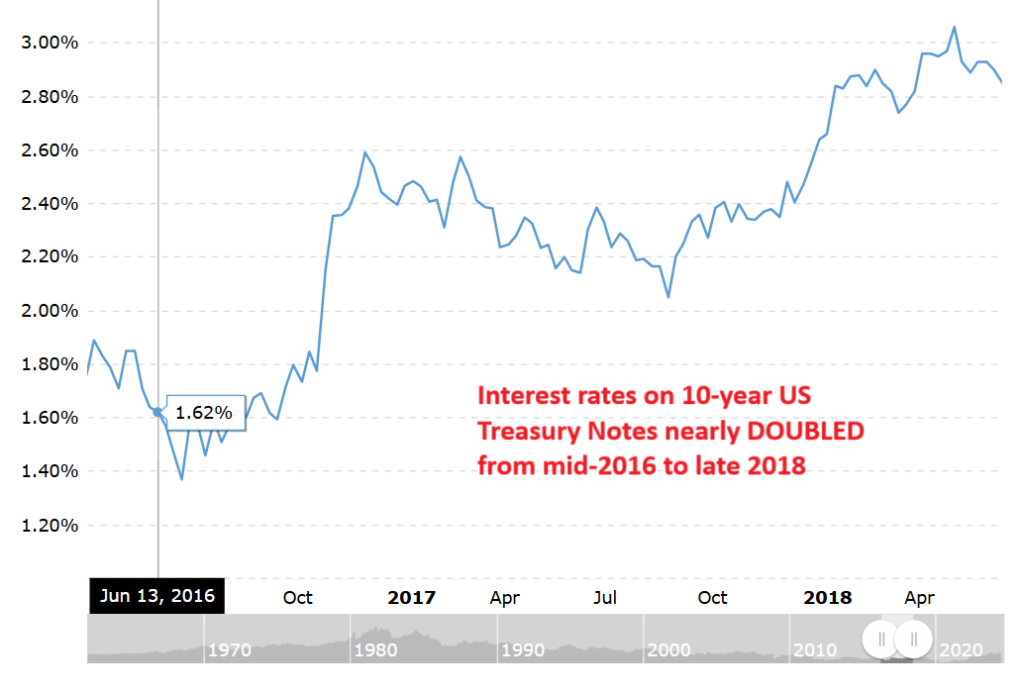
For one thing, a certain indicator recently reached an extreme that has been exceeded only once in the last 28 years (which is all the data available for that particular indicator). In that prior case (2016), interest rates on 10-year US Treasury notes nearly doubled from 1.6 to 3% in the following 16 months.
(As a sidenote, the Federal Reserve has a well-established history of FOLLOWING the open market of investors lending money to the US Treasury- also known as the US bond market- by eventually altering the Fed’s prime rate to “shadow” changes in interest rates that have already happened on the open market. That topic is for another article, but it is easy to verify for those who want to check themselves or to ask me for the data.)
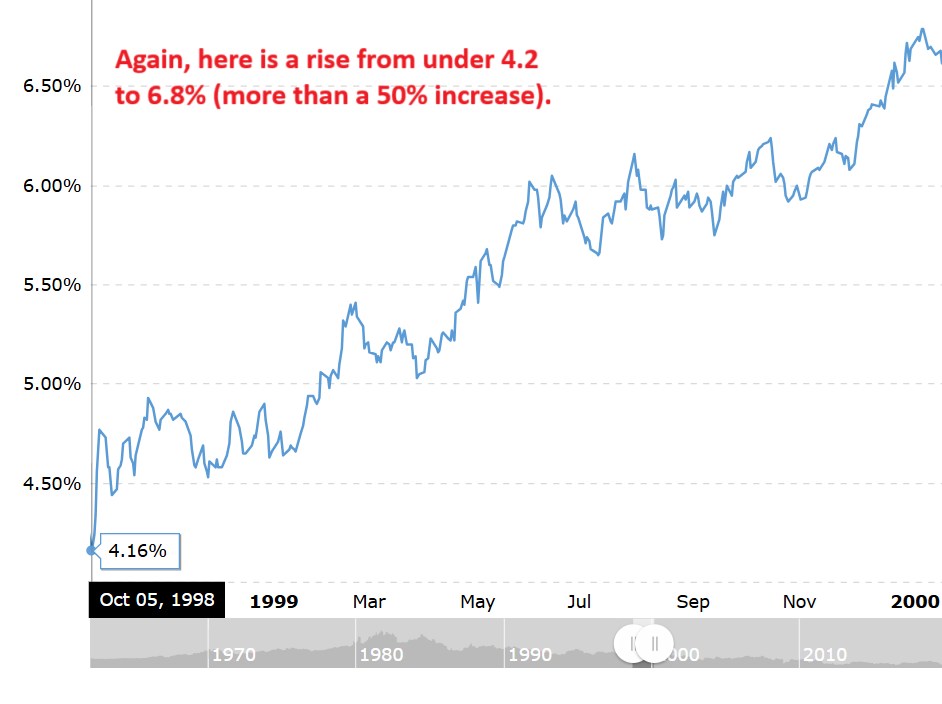
Next, back to the “leading indicator” that can be used for forecasting future changes in interest rates, we are now at the 2nd most extreme levels in 28 years. Here are 2 other cases that were a bit LESS extreme than the current market conditions as of mid-July 2024:
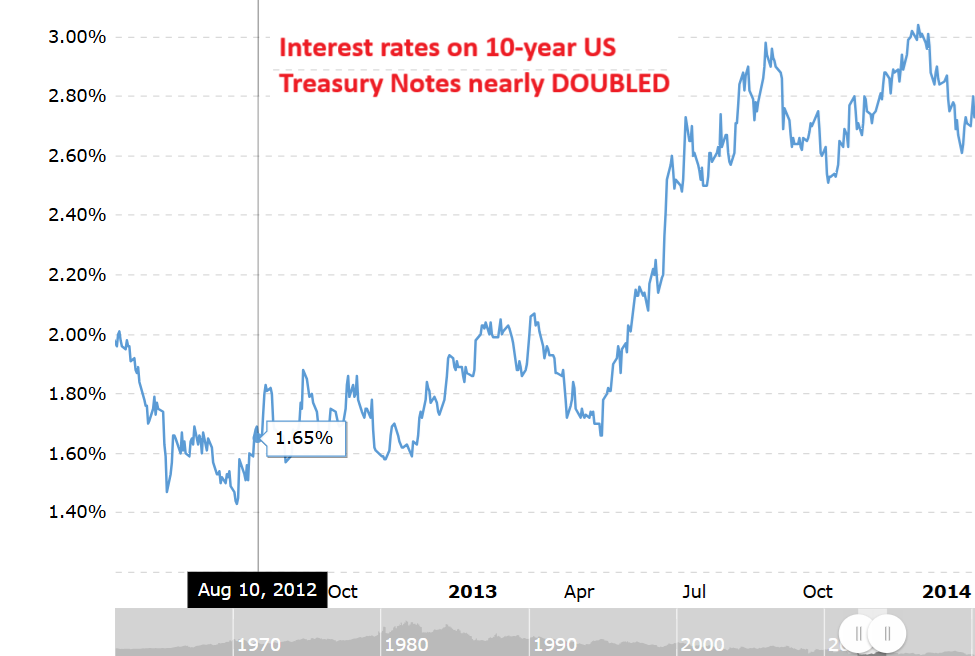
(On that one from a bit more than 10 years ago, the dates are different, but the rate change is quite similar.)
So, what do these three time periods look like together over the 28 years? Here they are (in red).
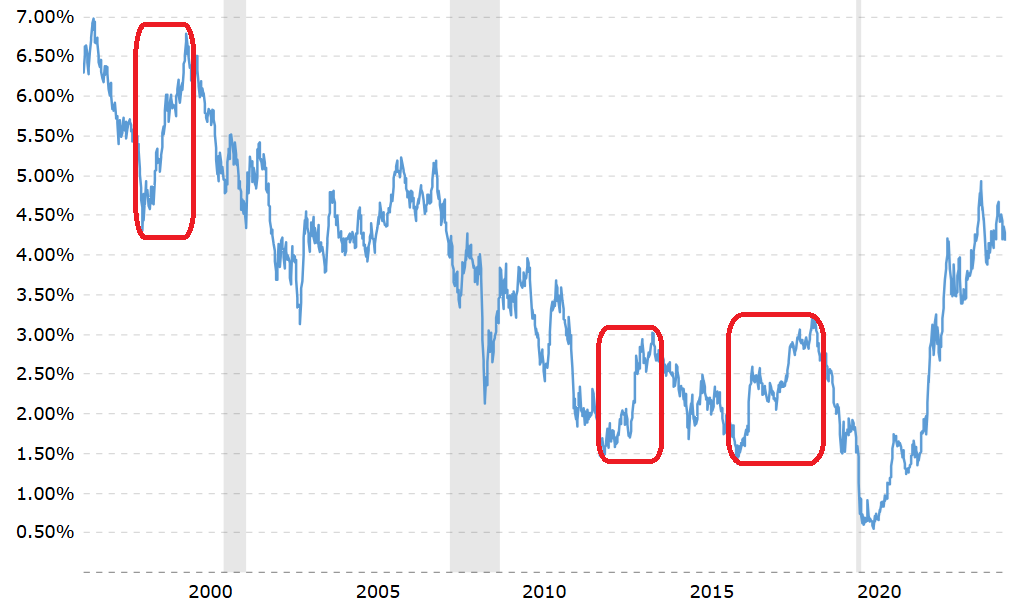
While a sample size of 3 is not very large, it is notable to me that for most of the last few decades, interest rates fell. However, these 3 “exceptions” do together form what we might call a “consistent pattern.” What do you see above?
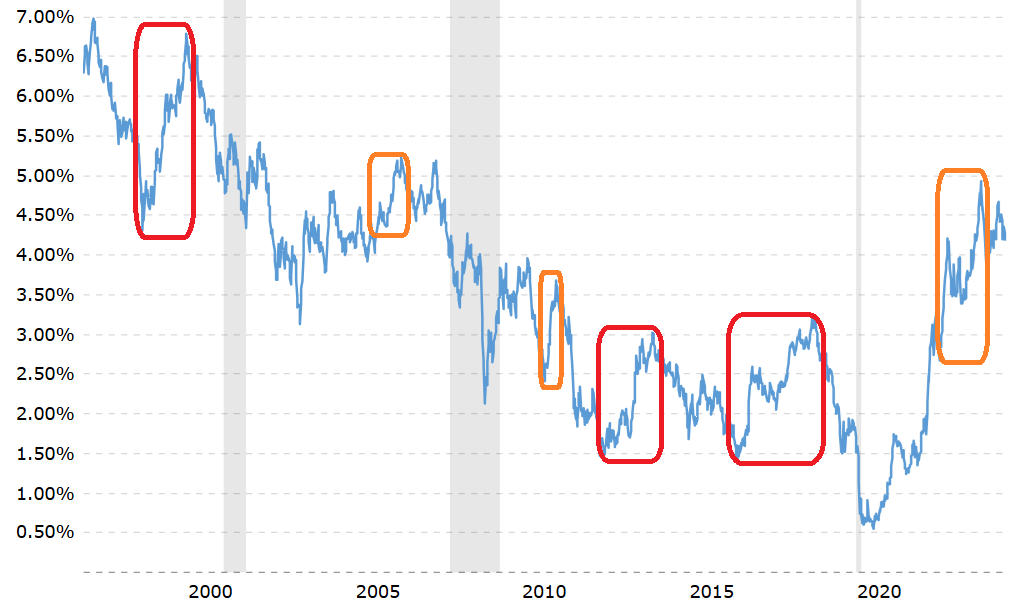
Next, since 3 out of 3 is better than 2 out of 3 but not as good as 6 out of 6, let’s add 3 more to our review. In orange, note the next 3 most extreme cases from the last few decades of US bond market conditions similar to what is present now in Mid-July of 2024.
Again, each of those 3 additional cases were also a large and lasting rise in interest rates. There were no cases of flat rates or falling rates. Further, of all the multi-month rises in interest rates across the last 28 years, those 6 cases covered a huge amount of them.
(So not only do interest rates consistently rise subsequent to the market conditions that are again present. They also rise only rarely in the absence of that condition. So while it may not be an essential cause, the current underlying condition might at least be a primary catalyst.)
So what is this extreme market condition currently?
Without permission to share the copyrighted data, I will only share the analysis here. I will say that my research analysis began with data from surveys that measure the optimism or pessimism of bond market investors. More specifically, I used a 20-day simple moving average of that survey data. Sorry, but that’s all that I will say about that here.
Is it guaranteed to work out this time (to go 7 for 7)?
Of course, the correlations I am referencing might not work out in this the 7th case… or at least not in a matter of the next few days. It could take weeks before a lasting rise manifests. Or again maybe this correlation will not repeat this time at all…. or will not be as large of a change in interest rates as the prior 6 cases.
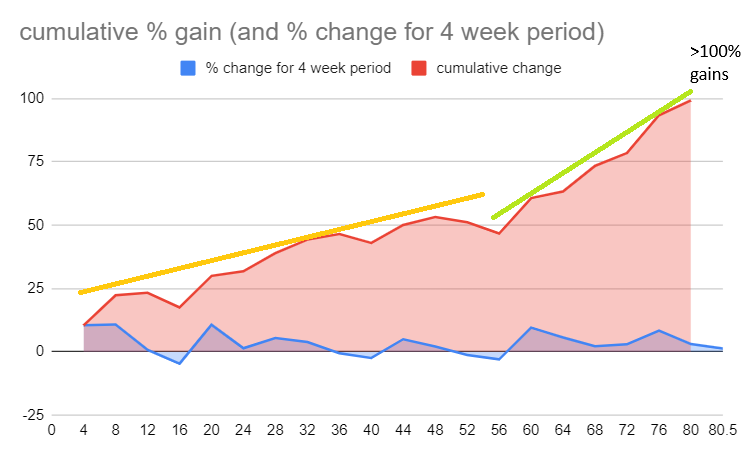
(However, I do have a lot more data behind my forecast than what I am revealing in this short article. Note that I am a rather active trader of the US bond market, including futures, ETFs, and options- so I invest time and money in researching VERY reliable correlations before I select and submit my trade orders. If I do not have good correlations to guide both my entry intro and exit from an investment, why shouldn’t I wait patiently? After all, my trading profits from my IRA recently soared past 100% in just over 80 weeks… and my non-IRA accounts have done much better than that this spring.)
(For more about my forecasting services or trading services, use the contact form to reach me.)
By the way, besides that I know the correlation above, why else should you care what I say?
Next, most people who have met me in the last few years may not be aware that I have long been a student of correlations and forecasting. I published forecasts starting in early 2003. In a 2004 publication of mine, I described a series of events that manifested from 2006-2009, which many people later labeled as a “global economic crisis.” My label in 2004 for it was “the DominOIL Effect” (based on my expectation for global fuel prices to soar and for that to trigger a specific series of “latent potentials”).
Link: https://web.archive.org/web/20041109082727/https://www.gold-eagle.com/editorials_04/fibonacci110704.html
A key detail of that analysis was that inflation-adjusted prices of gasoline had reached an all-time low in 1999 and had been rising. I discussed why that had been happening from 1999-2004 (when I wrote the article linked above), plus why I expected it to continue, plus what I expected it to trigger in global markets.

I published many updates from 2005-2008 as markets manifested the various outcomes that I had forecast and was tracking. Beyond that time period, I also published clear forecasts many other notable developments. Those include the 2009 recovery and the 2019 bond market dip plus the early 2020 stock market decline (and my forecast as usual was based solely on market data, not on any “psychic intuition” of a coming pandemic panic).
What are the longer-term potentials for interest rates in the US?
To read the companion article to this one, including a section about “so who is driving up interest rates?“…
Click here:
https://cad4.net/index.php/2024/07/16/what-are-the-longer-term-potentials-for-interest-rates-in-the-us/