
It’s actually the global economy slowing down (including the flow of debt/credit as well as the flow of energy commodities like crude oil and gasoline).
However, right this moment, the urgent thing that you need to do is simple. After I briefly cover that, then we can come back to the topics of (1) why that’s what you need to do and (2) how I know that and (3) why you should care what I say on the topic.
First, what I would tell any friend of mine is to quickly sell most or all of your stocks. Also important would be to start to liquidate actually most investments (even outside of stocks).
In a deflation, the purchasing power of cash skyrockets (as asset prices collapse). For illiquid investments, like commercial real estate or typical residential real estate, very soon it could be extremely hard to sell if buyer demand drops suddenly (and big factors in buyer demand are overall perceptions of the economy, plus current interest rates- each of which can change suddenly).
Why would I tell a friend these instructions? To keep it simple, I’ll stick to just two reasons. First, if you fail to exit soon, the price at which you eventually exit could be significantly lower than prices today on March 4th of 2025. And even more importantly, the much better investments that are available to you now soon will become much more expensive (so if you don’t get into those soon, the profit that you will have available will be greatly reduced).
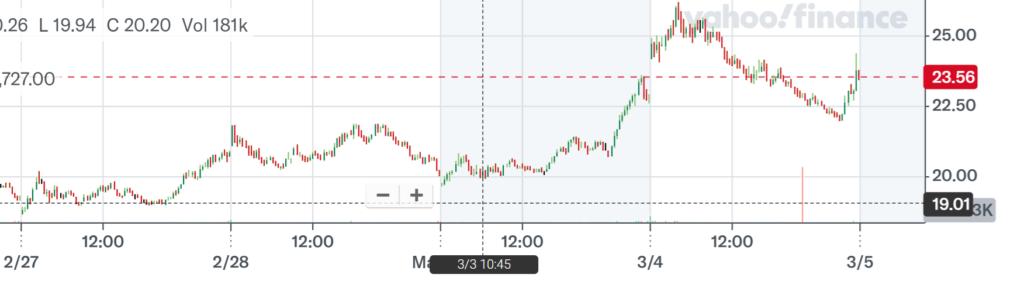
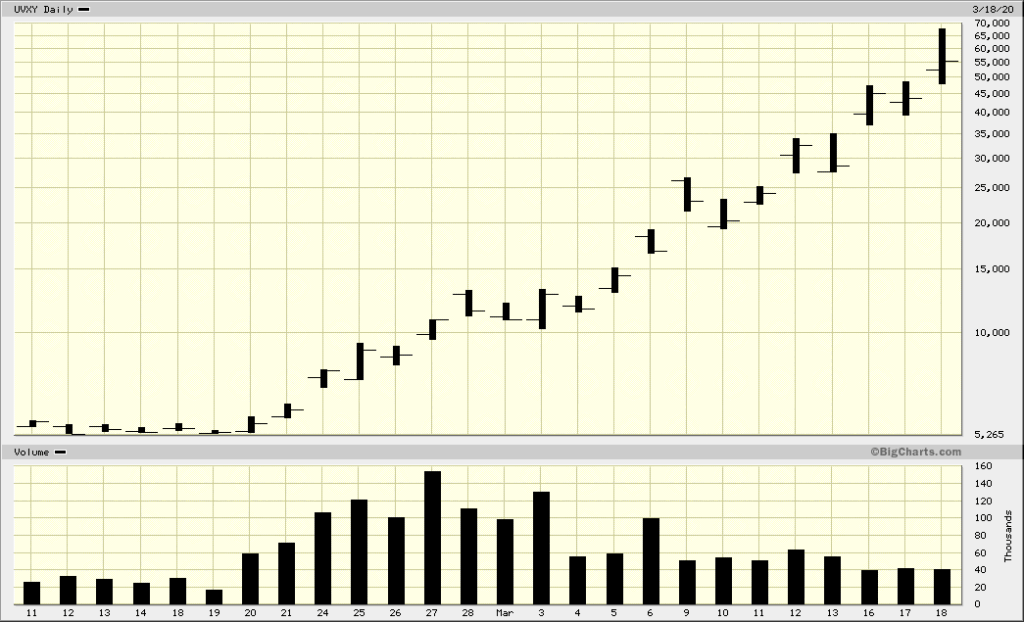
In fact, let’s quickly look at what you’ve already missed. Last Thursday (2/27), I was buying an investment instrument at $19 called UVXY. Early today (Tuesday March 4th) it was over $26. That’s a gain of over 37% in a few days.
I was selling it early today. But now it is back down to 23 (I wrote that sentence at about 2 pm EST on March 4th). What now? Is $23 still a deal or is this heading back below 20?
Actually, both could be true. It could head below 20 today or tomorrow but then also break out above 30 within a week.
You can see in the above chart showing what actually happened later today in that market. Since I am very comfortable with my multi-month forecast for that investment (WAY up), I can be comfortable with brief declines… relating to them as buying opportunities. Today, I just kept buying a little more as it kept falling and then sold whenever my open positions reached a profit. I bought in repeatedly and then sold at a profit SEVEN times today.
(Below are my actual orders for UVXY in 1 account today. The brokerage displays them with the newer actions at the top. So, to read what happened from morning into the rest of the day, start at the bottom.)
| 03/04/2025 15:51:09 | Sell | 555 | UVXY | Limit | 23.70 | DAY | Sold @ 23.735 | |
| 03/04/2025 15:34:14 | Buy | 56 | UVXY | Limit | 22.77 | DAY | Bought @ 22.77 | |
| 03/04/2025 15:25:25 | Buy | 66 | UVXY | Limit | 22.04 | DAY | Bought @ 22.04 | |
| 03/04/2025 14:51:26 | Buy | 56 | UVXY | Limit | 22.48 | DAY | Bought @ 22.48 | |
| 03/04/2025 14:12:00 | Buy | 44 | UVXY | Limit | 22.87 | DAY | Bought @ 22.8599 | |
| 03/04/2025 12:45:21 | Buy | 67 | UVXY | Limit | 23.60 | DAY | Bought @ 23.5499 | |
| 03/04/2025 12:40:34 | Buy | 111 | UVXY | Limit | 23.38 | DAY | Bought @ 23.38 | |
| 03/04/2025 10:56:48 | Buy | 111 | UVXY | Trailing Stop | 0.21 | DAY | Bought @ 25.4899 | |
| 03/04/2025 10:56:24 | Buy | 44 | UVXY | Trailing Stop | 0.11 | DAY | Bought @ 25.405 | |
| 03/04/2025 10:55:13 | Sell | 77 | UVXY | Limit | 25.39 | DAY | Sold @ 25.44 | |
| 03/04/2025 10:52:45 | Buy | 77 | UVXY | Trailing Stop | 0.16 | DAY | Bought @ 25.2999 | |
| 03/04/2025 10:51:37 | Sell | 177 | UVXY | Limit | 25.26 | DAY | Sold @ 25.28 | |
| 03/04/2025 10:50:10 | Buy | 45 | UVXY | Limit | 25.18 | DAY | Bought @ 24.94 | |
| 03/04/2025 10:44:53 | Buy | 66 | UVXY | Limit | 25.00 | DAY | Bought @ 25.00 | |
| 03/04/2025 10:42:27 | Buy | 66 | UVXY | Trailing Stop | 0.19 | DAY | Bought @ 25.1999 | |
| 03/04/2025 10:40:24 | Sell | 155 | UVXY | Limit | 25.35 | DAY | Sold @ 25.35 | |
| 03/04/2025 10:36:51 | Buy | 111 | UVXY | Limit | 25.17 | DAY | Bought @ 25.11 | |
| 03/04/2025 10:28:59 | Buy | 44 | UVXY | Trailing Stop | 0.36 | DAY | Bought @ 25.4599 | |
| 03/04/2025 10:20:23 | Sell | 66 | UVXY | Limit | 26.00 | DAY | Sold @ 26.075 | |
| 03/04/2025 10:00:28 | Buy | 66 | UVXY | Limit | 25.15 | DAY | Bought @ 25.1499 | |
| 03/04/2025 09:59:31 | Sell | 244 | UVXY | Limit | 24.90 | DAY | Sold @ 24.90 | |
| 03/04/2025 09:57:37 | Buy | 56 | UVXY | Limit | 24.75 | DAY | Bought @ 24.6599 | |
| 03/04/2025 09:54:24 | Buy | 66 | UVXY | Limit | 24.85 | DAY | Bought @ 24.85 | |
| 03/04/2025 09:43:53 | Buy | 122 | UVXY | Limit | 24.95 | DAY | Bought @ 24.94 | |
| 03/04/2025 09:42:05 | Sell | 44 | UVXY | Limit | 24.54 | DAY | Sold @ 24.69 | |
| 03/04/2025 08:30:49 | Buy | 44 | UVXY | Limit | 24.37 | Pre-Market | Bought @ 24.36 |
Not a lot of investments have the characteristics of that particular instrument. Also, the vast majority of the time it’s not a good investment. But occasionally, it’s by far the best investment that I know.
In early 2020 when I was publishing frequent warnings online about an impending decline in stock prices, I bought a lot of UVXY. Within a few weeks it rose over 1000%. That gain was very unusual.
It’s actually the global economy slowing down (including the flow of debt/credit as well as the flow of energy commodities…
If you don’t know, I have a long history of publishing clear class of major reversals in global economic markets. I published a warning in early 2009 of an impending rise in prices of stocks. I published warnings in 2007 and 2008 of a plunge in stock prices. In fact, going back in 2004 I published explanations of the sequence of events that came to be known as the global financial crisis.
I know several other authors who published similar analysis (at least of certain markets). But, actually to this day, I don’t know anybody who published the same analysis of a sequence of events that I labeled as The DominOIL Effect.
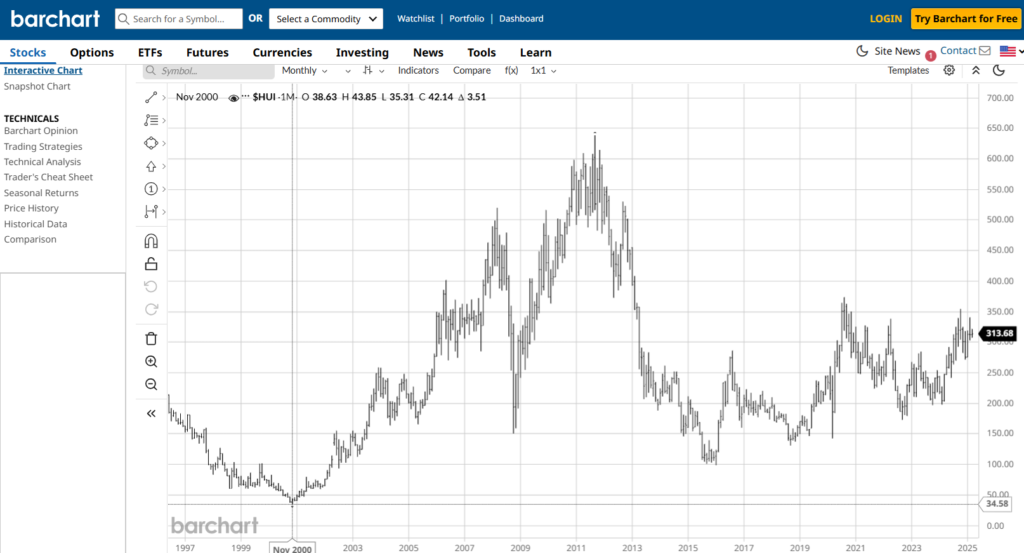
For me, the biggest long-term economic issue at the time was that global oil prices had risen from a low of around $11 in 1999 and were soaring. I explained my analysis of why they were soaring, and why I expected that rise to continue…. and eventually I even researched how far up it would go before dropping. Amazingly close to my expected target, it went up to as high as $148 by 2008. (That is a big increase from $11.)
While other people were focusing on stock market gains or real estate gains, which are all wonderful for the people benefiting from them, my research and publications featured some rather different content. In my first publication which was March 3, 2003, I actually featured an emphasis on a sector of the US stock market that went up eventually over 1600% that decade (from under $35 to over $640). However, across the same period, huge amounts of the US stock market, especially in the technology sector, did extremely poorly that decade (like still down more than 40% ten years after the peak).
So, it does matter which investments you select. Rotation into safe discounts away from overpriced unstable trends is still my basic investment method…. but I just am focused more than some people on finding the relevant data and then analyzing it and acting on it.
If you have retirement investments like stocks or bonds, those are relatively easy to liquidate to take advantage of more appealing opportunities. For investors in things like real estate, selling can be a much more difficult process when the market of buyers dries up.
So I covered a little bit about why you should care what I say on these topics. But what I did not say much here is why I’m saying this right now.
The reality is that there’s not that much new in markets in recent weeks. Some short-term data aligned with the long-term data and warnings that I published late last year about US stock prices (and U.S. treasury bonds/interest rates).
Here is one of those warnings again (from 12/19/2024): Stock prices and interest rates: up or down?
Those warnings are still totally relevant, but just with an elevated immediate risk…. like when there is not only a historic drought, but now a lightning storm is approaching the dry forest. Really, the key issue is the severity of the dry forest. It is not going to magically change. It is a huge long-term problem whether anything happens tomorrow or this week.
But this is not just a dry forest. This is worse… far worse. The overall long-term debt issues in the US plus in Europe and Asia are still huge burdens on future economic activity globally.
So yes there has been some new data in recent weeks. I saw a correlation showing a recent market conditionhas developed that only happens less than 10% of the time (and that condition consistently precedes declines in U.S. stock prices over the following year of about 20%). In fact, stock prices could go down a lot deeper than that and for a lot longer than a year.
On the other hand, are there areas and industries with particular strength in the global economy? Of course! Guyana’s Economy is still growing at double digits every year as it has for many years in a row. Among Bigger nations, India’s economy is growing at nearly 7% per year. I do expect that to continue there.
But, according to my current analysis, things are going to get rough economically in a lot of places and for a long time. A huge issue is debt, but that is a financial issue rather than a core economic issue (like a financial issue is about accounting, so it could be resolved by invasions or political deals).
The biggest emerging economic issue (to me) is delivery of energy infrastructure. The only way around the emerging energy shortage would be either a massive technological advance or a huge decrease in human population (or both).
Unless you’ve seen the data, you have no idea of the scale of the issues that are present. As a trader, my interest is focusing on the actionable data. So that’s why since last July (2024) I focused so much in my publications on the emerging problems in the US treasury bond market and why I expect interest rates to go very high very quickly within the next one to two years.
Here is my bond market commentary from July 16, 2024: Interest rates: up or down?
As an investor, it is so easy to position to profit from historic extremes (like what has been going on in the US Bond market as well as in the US stock market). Is it easy to make the decision to position in alignment with market data? To me, it is easy. The only issue was really specific adjustments of exposure across time.
But with the historic extremes in recent market conditions, it couldn’t be any easier to recognize the cost of inaction as well as the potential benefit of adaptive action. For those that want to learn more about how I can help you reduce overall risk while rotating into the best opportunities, let me know.